Complex Image: Minard's Chart

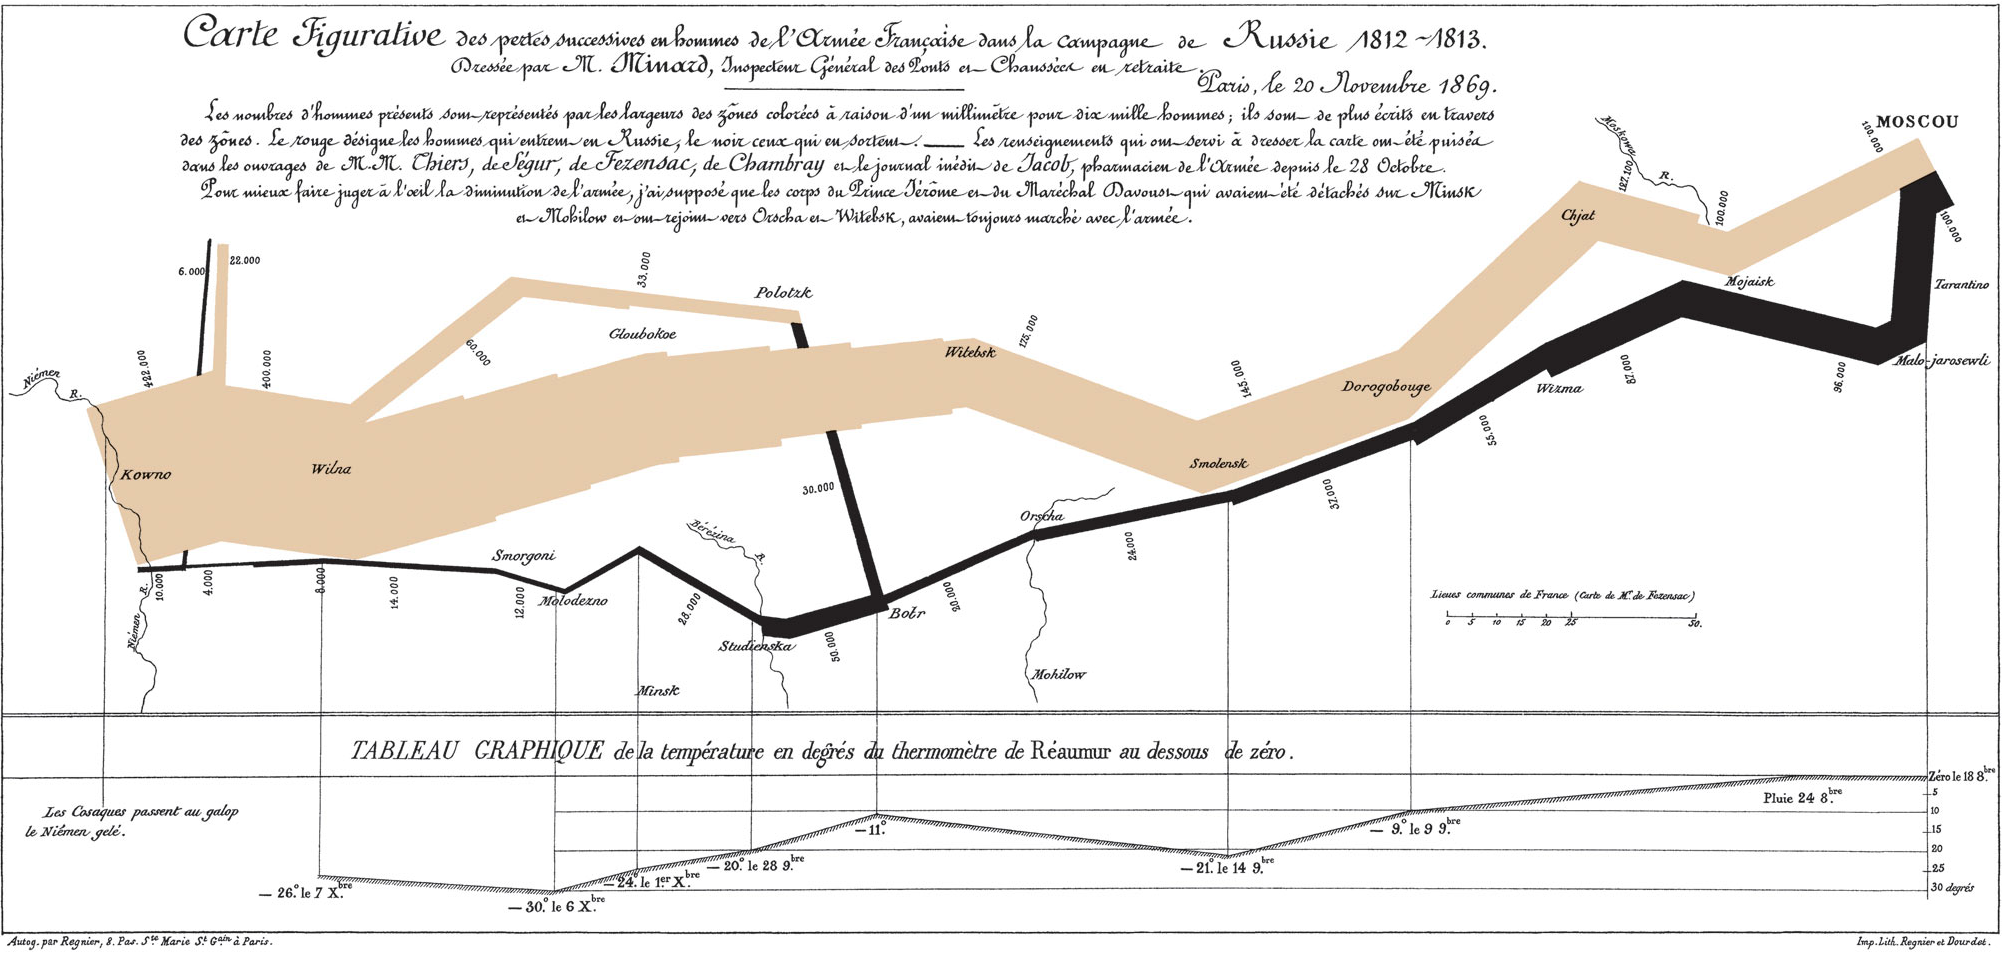
Figurative Map of the successive losses in men of the French Army in the Russian campaign 1812-1813. Drawn by Mr. Minard, Inspector General of Bridges and Roads in retirement. Paris, 20 November 1869.
The numbers of men present are represented by the widths of the colored zones in a rate of one millimeter for ten thousand men; these are also written beside the zones. Red designates men moving into Russia, black those on retreat.
The information used for drawing the map were taken from the works of Messrs. Thiers, de Ségur, de Fezensac, de Chambray and the unpublished diary of Jacob, pharmacist of the Army since 28 October.
In order to facilitate the judgement of the eye regarding the diminution of the army, I supposed that the troops under Prince Jèrôme and under Marshal Davoust, who were sent to Minsk and Mobilow and who rejoined near Orscha and Witebsk, had always marched with the army.
Note: A French translation from Wikipedia.
Data Table for Minard's Chart
Data for Charles Minard's Chart of Napoleon's Invasion of Russia
| Location | Approximate Date | Size of Army | Temperature C | Temperature F | Direction"> |
|---|---|---|---|---|---|
| Kowno River | June 24th | 442,000 | na | na | Advance |
| Wilna | June 30th | 400,000 | na | na | Advance |
| Witebsk | na | 175,000 | na | na | Advance |
| Smolensk | August 16th | 145,000 | na | na | Advance |
| Chjat | na | 127,000 | na | na | Advance |
| Mojaisk | September 7th | 100,000 | na | na | Advance |
| Moscow | September 14th | 100,000 | na | na | Advance |
| Malo-jarosewli | October 18th | 96,000 | 0 | 32 | Retreat |
| Mojaisk | October 24th | 87,000 | 0 | 32 | Retreat |
| Wirma | na | 55,000 | na | na | Retreat |
| Smolensk | November 14th | 37,000 | -26 | -13 | Retreat |
| Orscha | na | 24,000 | na | na | Retreat |
| Botr | na | 20,000 | -14 | -7 | Retreat |
| Studienska (reinforcements arrive) | December 1st | 50,000 | -25 | -13 | Retreat |
| Minsk | December 1st | 28,000 | -30 | -22 | Retreat |
| Moloderno | December 6th | 28,000 | -38 | -34 | Retreat |
| Smorgeni | December 7th | 12,000 | -33 | -27 | Retreat |
| Wilna | na | 8,000 | na | na | Retreat |
| Kowno (reinforcements arrive) | December 14th | 10,000 | na | na | Retreat |
Code
Overview
- Complex images contain substantial information – more than can be conveyed in a short phrase or sentence. These are typically:
- Graphs and charts, including flow charts and organizational charts.
- Diagrams and illustrations where the page text relies on the user being able to understand the image.
- Maps showing locations or other information such as weather systems.
- Complex images have two-parts for the text alternative:
- The first part is the short description to identify the image and, where appropriate, indicate the location of the long description.
- The second part is the long description – a textual representation of the essential information conveyed by the image.
- This example uses the
figcaptionto provide a longer description of the image and is visible to everyone, ensuring that it will be a more accurate description of the image. - A
detailsandsummaryelements are used to provide a data table of the information shown in the image.